import pandas as pd
import numpy as np
from sklearn.cluster import KMeans
from _helpers import (
    unify_null_vals,
    interpolate_missing,
    evaluate_number_of_clusters,
    find_optinal_seed,
    calculate_proportions,
    plot_ternary_map,
)Part 1: Segmentation on Questionnaire Data
In this tutorial, we segment questionnaire respondents using K-Means clustering on synthetic human values data. We go through data preprocessing, identifying the optimal number of clusters, and apply K-Means to group individuals. Our analysis identifies three distinct segments based on their value profiles: individualists, idealists, and communitarians. Finally, we map and present the geographical distribution of these segments across Europe.
You can find the code here.
Intro
Organisations often deal with diverse groups – customers, users, counterparties, stakeholders – where any single approach will short-change one group or another. This can be addressed by heuristically dividing the undifferientiated mass into different categories, but a more powerful approach is available: running a segmentation on some quantitative data about each individual. Through segmentation, we can identify the set of subgroups that best captures the clusters of similarity in a population. Once identified, these segments can be used for analytical purposes, to understand the customers (users, etc) better, and to adapt the behaviour of the organisation towards them to best serve each in their own way.
Questionnaire data
Often, these segmentations are run on demographic or other ‘passive’ variables, but in this tutorial we focus on the usecase of segmenting on a set of responses to items in a questionnaire. The meaning of these segments depends entirely on the meaning of the variables that it is calculated on: they can be on habits or lifestyle factors, preferences within a particular product category, or features of a specific product. Here, we run a segmentation on publicly accessible data to show you how to do it, but this becomes a much more powerful tool on proprietary data.
Requirements
To follow this tutorial, you need to clone the repository. The synthetic data is already provided. To create the interactice map of the segment distribution, you will also need the geographic data under “Admin 0 - Countries” from natural earth data.
You also need a functional Python environment with numpy, pandas, scikit-learn, scipy, geopandas, folium, branca, shapely and matplotlib installed. For the model export at the very end, you’ll also need to install ‘diagonalpy’, an account with diagonal.sh and a valid diagonal.sh console API key.
K-Means Clustering
One powerful technique for creating these data-driven segments is k-means clustering. This algorithm takes the quantitative data associated with each individual (like questionnaire responses or behavioral metrics) and mathematically sorts them into a specified number (‘k’) of distinct groups. The core idea is to minimize the variation within each cluster, ensuring members are as similar as possible on the measured variables, while maximizing the difference between the clusters. It achieves this iteratively, finding the best central ‘prototype’ for each group and assigning individuals accordingly, thus objectively defining the underlying structure of similarity within the population.
Lets start by importing our dependencies:
Set clustering columns
In this tutorial, we will segment the population on synthetic human values questions, which are listed below. These data are generated to imitate responses on a 6 point Likert scale.
col_to_question = {
    'pyultt': 'To what extent do you prioritize unconventional thinking, even if it challenges established norms?',
    'fsflss': 'How central is achieving significant financial success to your overall life plan?',
    'cnslds': 'How strongly do you feel about actively working towards a society with fewer disparities?',
    'ndelvn': 'How much validation do you seek from others regarding your skills and competence?',
    'pepysy': 'How much do you value predictability and risk avoidance in your immediate environment?',
    'ostoceny': 'How readily do you embrace significant changes and unfamiliar experiences in your life?',
    'rtfrpeay': 'How much importance do you place on respecting established procedures and authority?',
    'mnpetg': 'How motivated are you to genuinely grasp perspectives that differ greatly from your own?',
    'pefrus': 'To what degree do you prefer to remain unobtrusive and avoid the spotlight?',
    'pydyle': 'How high a priority is integrating leisure and enjoyment into your daily routine?',
    'vesfdn': 'How resistant are you to external constraints on your personal choices and actions?',
    'seryfros': 'How strong is your sense of personal responsibility for contributing to the well-being of others?',
    'defrrdat': 'How driven are you to achieve tangible results that are publicly acknowledged?',
    'pedelpsy': 'How much do you prefer decisive leadership as a means to maintain social stability?',
    'rktefret': 'How willing are you to take personal risks in pursuit of stimulating or thrilling experiences?',
    'aetoslee': 'How conscientious are you about adhering to social etiquette and accepted codes of conduct?',
    'defrslsg': 'How significant is achieving a high social standing and being held in esteem by your peers?',
    'esonrlss': 'How much emphasis do you place on steadfastness and prioritizing your commitments within close relationships?',
    'cttocn': 'How deep is your personal commitment towards conservation and maintaining ecological balance?',
    'veclcy': 'How much value do you place on maintaining continuity with past practices and cultural heritage?',
    'iniegn': 'How inclined are you to prioritize activities that offer immediate enjoyment and gratification?'
}

clustering_cols = list(col_to_question.keys())
Read data
path = "data/synthetic-values-questionnaire.csv"
data = pd.read_csv(path)
pd.Series(data[clustering_cols].values.flatten()).value_counts()
Fill in missing data
Since the data we use here are synthetic, there are actually no “None” or missing data. However, if you want to use this notebook on other, real data, this is likely to become an issue. The cell below map all “None” or “N/A” values to one value, and then use linear interpolation to fill in missing values.
data[clustering_cols] = unify_null_vals(data[clustering_cols], [66, 77, 88, 99], 99)
data = interpolate_missing(
    data,
    np.array(clustering_cols),
    none_val=99,
    max_incomplete=9,
    min_max_vals={col: (1, 6) for col in clustering_cols},
)
pd.Series(data[clustering_cols].values.flatten()).value_counts()
Reverse scale for interpretability
data[clustering_cols] = 7 - data[clustering_cols].valuesNormalize clustering columns
Some participants typically agree or disagree pretty uniformly (uniform agreement is more common). To control for this and evaluate the relative importance of these different values to participants, we normalize the responses per row, so that they sum to 0. This also centers the responses of each participant on 0.
clustering_cols_normalized = [f"{col}_normalized" for col in clustering_cols]
data[clustering_cols_normalized] = data[clustering_cols].values - np.repeat(
    np.mean(data[clustering_cols].values, axis=1), len(clustering_cols)
).reshape(data.shape[0], len(clustering_cols))
Determine number of clusters
We evaluate the number of clusters that we should set for our K-Mean algorithm later in a two-step process. We use the inertia value to calculate the “goodness-of-fit” of a segmentation. It measures the sum of squared distances between the centroid (mean value of all its members) of a segment, and the coordinates of the members of that segment. It is in some sense the analogue of the Mean Squared Error (MSE) metric in linear regression. As we increase the number of clusters, the inertia mechanically goes down, as any additional centroid (that can be output by the K-Means algorithm) reduces the distance between at least one observation and the centroid of its cluster. Looking for the global minimum of inertia values would lead to creating one segment for each observation, and we would have gained nothing.
A common alternative approach to make the trade-off between reducing the inertia and keeping the number of segments low is the ‘elbow-method’. It consists in varying the number of segments and measuring the inertia they produce, and plotting them on a line-chart. The point of the “elbow” is the number of clusters at which increasing that number creates a noticeably lower reduction in inertia than previous such increases. This is implemented in evaluate_number_of_clusters in two steps: first, a smooth function is fitted on the inertia values of an increasing number of clusters, and then the second derivative is taken, and the value k that is closest to the maximum value of the second derivative, and is above the manually set value k_min, is selected.
n_clusters = evaluate_number_of_clusters(
    data[clustering_cols_normalized].values, k_max=12
)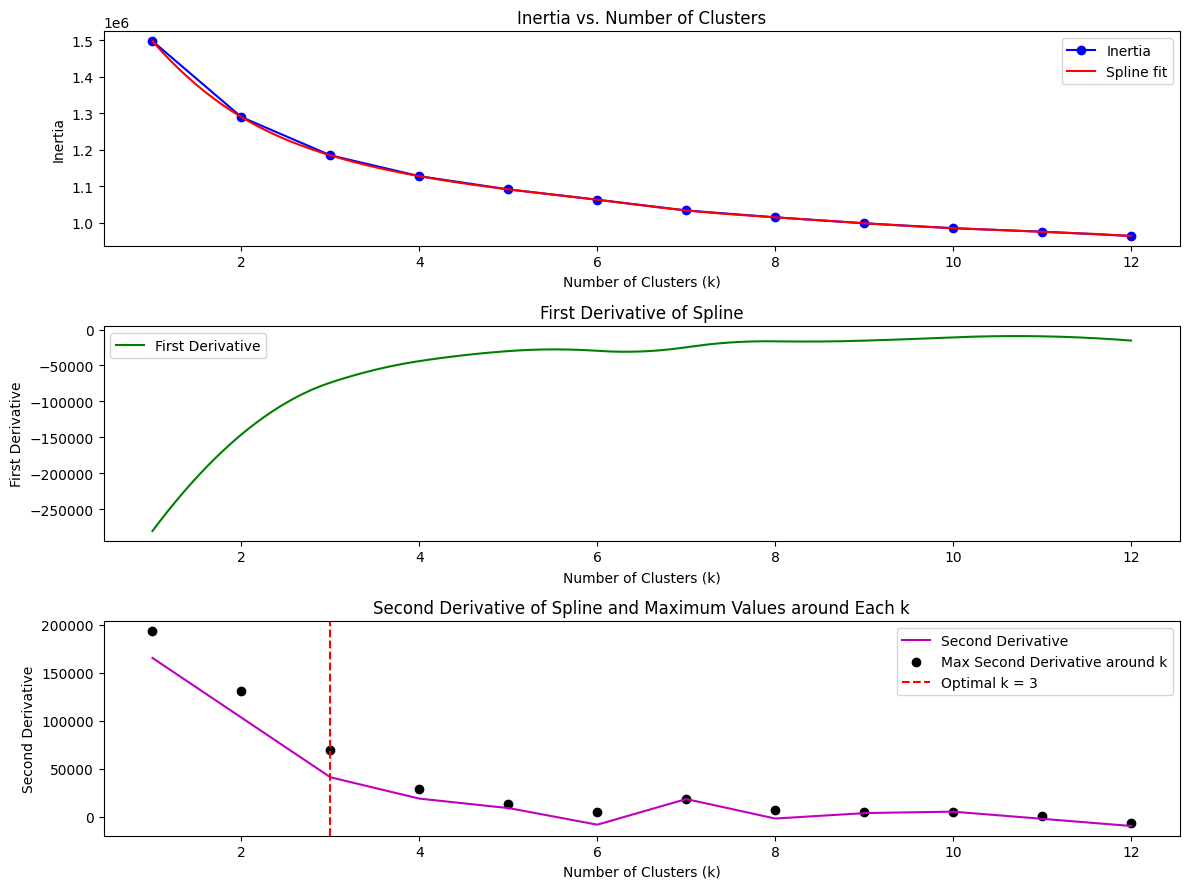
optimal_clusters = 3Find seed with maximum overlap
The final segmenation that is created by the K-Means algorithm partly depends on the random initialization, set by the random_state parameter. Instead of choosing one at random, we can run the clustering algorithm using different random_state values, and evaluate them for the overlap between the resulting segmentations. The seed that creates a segmentation with the highest average overlap with other segmentations is in some sense more “representative” than the others. This seed is identified below.
print(f"{n_clusters = }")
optimal_seed = find_optinal_seed(
    data[clustering_cols_normalized].values, 100, 50, n_clusters
)
Identify segments
Here, we use the optimal number of clusters that we identified, and the optimal seed to fit the final, real segmentation on the data. We then output it to a file.
kmeans = KMeans(n_clusters=n_clusters, random_state=optimal_seed)
kmeans.fit(data[clustering_cols_normalized])
data["segment"] = kmeans.labels_
data.to_csv("data/synthetic-value-questionnaire-segment.csv", sep=",", index=False)
Analysis
Look at segment profiles on clustering columns
We first look at the profiles of the three segments we identified across the variables we used for the segmentation. This will allow us to understand better what makes each segment unique, and the differences between segments.
Segment 1 stands out as highly valuing structure, achievement, and social recognition. Members prioritize established procedures, respect for authority, and decisive leadership to maintain stability. They are strongly motivated by financial success, achieving publicly acknowledged results, and gaining high social standing. Compared to other segments, they show less inclination towards unconventional thinking, embracing change, or actively working towards social equality, and place a lower emphasis on environmental conservation. They prefer predictability and are more risk-averse. We will call this segment the “individualists”.
Segment 2 is characterized by a strong emphasis on personal freedom, openness to experience, and challenging norms. This group readily embraces significant life changes, resists external constraints on their choices, and values integrating leisure into daily life. Unlike Segment 1, they show less respect for established authority and procedures and are less concerned with financial success or social standing. They demonstrate a higher motivation to understand differing perspectives and work towards a society with fewer disparities, alongside a greater willingness to take personal risks for stimulating experiences compared to the other segments. This segment we call the “idealists”.
Segment 3 distinguishes itself through a profound sense of social and environmental responsibility, coupled with a preference for stability and avoiding the spotlight. This segment places the highest importance on contributing to the well-being of others, conservation, and working towards social equality. They value predictability, steadfastness in relationships, and maintaining continuity with cultural heritage. In stark contrast to Segment 1, they show very little drive for financial success, public acknowledgment, or high social standing, and seek minimal external validation. They are also the most risk-averse and least inclined towards immediate gratification or thrill-seeking. This segment we call the “communitarians”.
data[clustering_cols].groupby(data["segment"]).agg(
    {c: "mean" for c in clustering_cols}
).rename(columns=col_to_question).T| segment | 0 | 1 | 2 |
|---|---|---|---|
| To what extent do you prioritize unconventional thinking, even if it challenges established norms? | 2.826576 | 4.419726 | 3.162608 |
| How central is achieving significant financial success to your overall life plan? | 4.436975 | 3.625510 | 2.423958 |
| How strongly do you feel about actively working towards a society with fewer disparities? | 2.448214 | 3.913052 | 4.106170 |
| How much validation do you seek from others regarding your skills and competence? | 3.334244 | 2.847794 | 1.817891 |
| How much do you value predictability and risk avoidance in your immediate environment? | 4.047059 | 2.540693 | 3.958832 |
| How readily do you embrace significant changes and unfamiliar experiences in your life? | 2.788445 | 4.615035 | 2.979983 |
| How much importance do you place on respecting established procedures and authority? | 4.410294 | 2.333797 | 3.888981 |
| How motivated are you to genuinely grasp perspectives that differ greatly from your own? | 2.510189 | 3.999166 | 3.925299 |
| To what degree do you prefer to remain unobtrusive and avoid the spotlight? | 3.201155 | 3.024194 | 4.271771 |
| How high a priority is integrating leisure and enjoyment into your daily routine? | 3.366702 | 4.139507 | 2.878044 |
| How resistant are you to external constraints on your personal choices and actions? | 2.748424 | 4.457916 | 3.160442 |
| How strong is your sense of personal responsibility for contributing to the well-being of others? | 3.887920 | 4.145254 | 4.951197 |
| How driven are you to achieve tangible results that are publicly acknowledged? | 4.428782 | 3.610122 | 2.452538 |
| How much do you prefer decisive leadership as a means to maintain social stability? | 4.605882 | 2.340934 | 3.694181 |
| How willing are you to take personal risks in pursuit of stimulating or thrilling experiences? | 2.402101 | 3.606136 | 1.878560 |
| How conscientious are you about adhering to social etiquette and accepted codes of conduct? | 4.002836 | 2.668613 | 3.914878 |
| How significant is achieving a high social standing and being held in esteem by your peers? | 4.453361 | 3.587690 | 2.459451 |
| How much emphasis do you place on steadfastness and prioritizing your commitments within close relationships? | 3.387395 | 3.068780 | 4.083161 |
| How deep is your personal commitment towards conservation and maintaining ecological balance? | 2.748424 | 3.493511 | 4.217705 |
| How much value do you place on maintaining continuity with past practices and cultural heritage? | 4.140336 | 2.435484 | 4.057367 |
| How inclined are you to prioritize activities that offer immediate enjoyment and gratification? | 2.722164 | 3.369577 | 1.827177 |
Label segments
segment_to_name = {
    0: "individualist",
    1: "idealist",
    2: "communitarian"
}
Look at country composition
country_shares = calculate_proportions(data, "country", "segment", segment_to_name)i = 9
country_shares.iloc[i * n_clusters : (i + 1) * n_clusters, :]| country | segment | count | total | proportion | |
|---|---|---|---|---|---|
| 27 | EST | individualist | 408 | 1000 | 0.408 |
| 28 | EST | idealist | 309 | 1000 | 0.309 |
| 29 | EST | communitarian | 283 | 1000 | 0.283 |
Create ternary color map
map_object = plot_ternary_map(
    country_shares_pivot,
    geojson_path="../../supporting-data/ne_50m_admin_0_countries/ne_50m_admin_0_countries.shp",
    iso_col="country",
    prop_cols=list(segment_to_name.values()),
    lat_bounds=(30, 75),
    lon_bounds=(-40, 40),
    scope="europe",
)
Loading and filtering geographic data to region: lat=(30, 75), lon=(-40, 40)
Filtered to 67 features in the regionmap_object.save("output/ess-human-values-segment-map.html")
map_objectMake this Notebook Trusted to load map: File -> Trust Notebook